
The district average was £384,977 in July, up £94 on a year earlier and still 8.1% below the 2022 peak. Flats fell 3% and are back at 2020 prices.
The average New Forest home was worth £384,977 in July. A year earlier it was worth £384,883. Twelve months of a housing market have moved the district average by £94, or 0.0 per cent.
The figures are from the Land Registry UK House Price Index, published on 16 September.
It is one of the flattest years the district has recorded. Since the index begins in December 2009, only three other months have posted a smaller twelve month change in cash terms: May 2023, at minus £40, December 2011 at £81 and July 2013 at £84.
One caveat before the rest of the numbers, because it changes how to read all of them. The UK House Price Index is a mean average across every sale in the district, not a median. A handful of large sales at Beaulieu or Milford on Sea pulls the figure up in a way it would not pull up a median. It shows direction well and tells you little about what any particular house is worth.
Flats fell, everything else edged up
The flat headline hides a split. Three of the four property types rose over the year, one fell, and the one that fell is the cheapest way into the district.
| Type | July 2026 | Change on the year |
|---|---|---|
| Detached | £584,457 | +£2,147 (+0.4%) |
| Semi-detached | £370,670 | +£3,813 (+1.0%) |
| Terraced | £300,784 | +£2,182 (+0.7%) |
| Flat or maisonette | £196,626 | -£6,022 (-3.0%) |
| First-time buyer average | £291,909 | +£152 (+0.1%) |
At £196,626 the average New Forest flat is back below £200,000. The last time the average was this low was December 2020. Every month from January 2021 to February 2026 was higher.
The gap between a flat and a terraced house in the district is now £104,158. Last July it was £95,954. One went up and the other went down, and the cheapest rung of the ladder pulled away from the next one.
Still £33,805 below the 2022 peak
The district average peaked at £418,782 in September 2022. July’s figure is £33,805 below that, or 8.1 per cent. Nearly four years on, the recovery has not happened here.
Each property type has its own peak, and they have not come back at the same speed.
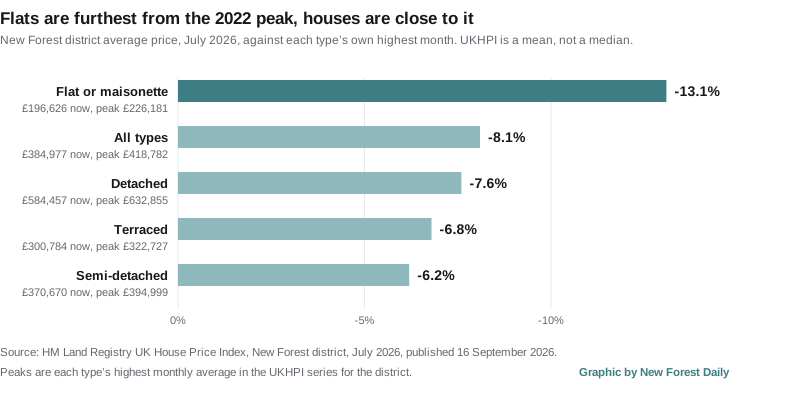
Houses are within about seven per cent of where they were at the top of the market. Flats are 13.1 per cent below theirs, and they are the only type still going backwards.
Eighth of Hampshire’s eleven districts
New Forest is the fourth most expensive of Hampshire’s eleven districts, behind Hart, Winchester and East Hampshire. On the year, it ranks eighth.
| District | July 2026 average | Annual change |
|---|---|---|
| Gosport | £240,696 | +3.4% |
| Eastleigh | £310,283 | +2.6% |
| Hart | £481,051 | +2.6% |
| Winchester | £463,025 | +2.1% |
| Fareham | £333,599 | +1.4% |
| Basingstoke and Deane | £370,223 | +1.0% |
| Rushmoor | £326,771 | +0.5% |
| New Forest | £384,977 | 0.0% |
| Test Valley | £368,131 | -0.6% |
| East Hampshire | £440,541 | -1.2% |
| Havant | £315,820 | -1.2% |
Two comparisons are worth holding on to. The New Forest average is higher than the South East average of £380,878 and higher than the Hampshire average of £364,336. Yet the average New Forest flat, at £196,626, is cheaper than the average flat in England, which is £217,362, and cheaper than the average South East flat at £207,581.
Expensive district, cheap flats. That is the shape of the New Forest market at the moment.
June has been revised up
One housekeeping note, because it affects the month on month figure. When we reported June’s average last month it stood at £380,310. The Land Registry has since revised it to £381,140, £830 higher. April and May were revised up as well.
That matters because July’s rise on June is now 1.0 per cent, the third biggest monthly rise of Hampshire’s eleven districts, behind Gosport at 2.1 per cent and Fareham at 1.3. Revisions run through this index every month. A figure two or three months old is firmer than last month’s.
Sales volumes are revised hardest of all, and lag furthest behind. The most recent month the Land Registry publishes a count for is May 2026. On the figures as they stand, 816 New Forest homes changed hands between January and May this year, against 1,111 in the same five months of 2025. Expect that 816 to rise as late registrations come in, so treat the direction as real and the size of the fall as provisional.
What it means for you
- If you are selling a house, the district average has not moved in a year and is still 8.1 per cent below September 2022. Asking prices carried over from the 2022 market are asking the market for something it has not paid since.
- If you are selling a flat, the average is back where it was at the end of 2020, and it fell 3 per cent over the last year while houses rose. This is the part of the market taking the strain.
- If you are buying your first home, the district first-time buyer average is £291,909, up £152 on the year. It is £26,545 below its 2022 peak.
- Before you compare anything to a neighbour’s sale, remember this is a mean across the whole district, from Fordingbridge to Hythe. It is not a valuation. Our New Forest house prices page keeps the longer run, and the council tax bands page covers what the band actually costs once you have bought.
Sources
- HM Land Registry UK House Price Index, New Forest district, for every New Forest figure above, including the July 2026 average of £384,977, the July 2025 average of £384,883, the breakdown by property type, the first-time buyer average, the September 2022 peak of £418,782, the August 2022 flat peak of £226,181, the revised monthly averages for April, May and June 2026 and the monthly sales counts.
- GOV.UK, UK House Price Index for July 2026, published 16 September 2026, for the release date.
- The same index for Gosport, Eastleigh, Hart, Winchester, Fareham, Basingstoke and Deane, Rushmoor, Test Valley, East Hampshire and Havant, and for Hampshire, the South East and England, for the comparisons.
- New Forest house prices up £4,050 in June to £380,310, our own report of 21 August 2026, for the pre-revision June figure.
Have your say